HIST_THRESH_CVIP
hist_thresh_cvip() - Performs adaptive thresholding segmentation.
Contents
SYNTAX
outImage = hist_thresh_cvip(inImage, pct)
Input Parameters include :
- inImage - 1-band input image of MxN size or 3-band input image of MxNx3 size.The input image can be of uint8 or uint16 or double class.
- pct - Selects principal component transform (PCT) to convert multiband image to one band.(Only if inImage has more than one band) pct = 1 [PCT method] pct = 0 [RGB to gray conversion]
Output Parameter includes:
- outImage - Segmented image.
DESCRIPTION
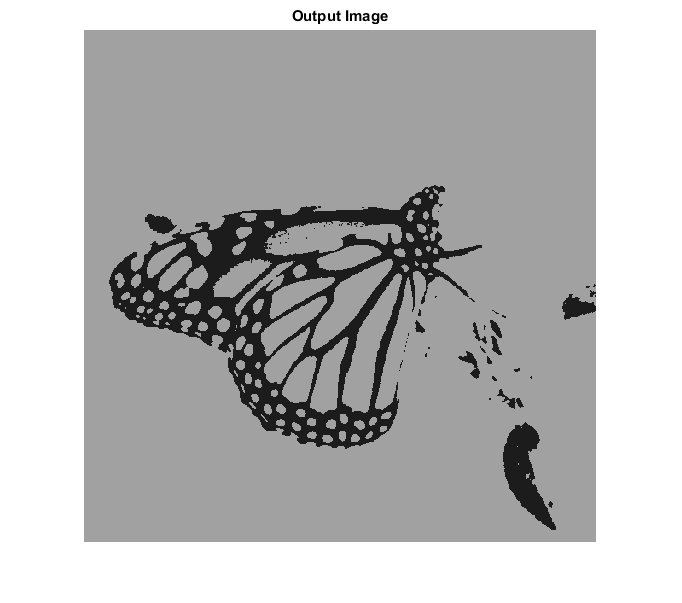
The function performs adaptive thresholding segmentation. First,the function automatically finds the number of thresholds by finding peaks and valleys in an image histogram. To find the most important peaks,the histogram is smoothened using an average filter of length 7 (experimentally selected). The peaks lower than 20% of maximum peak value or not 10% higher than their valleys are discarded (experimentally choosen; it may not be optimal on all applications, change maxpeak3peak ratio and peak2val ratio in peak valley find function if needed). The valleys are only considered in between two peaks. The number of thresholds is equal to number of valleys. Once the peaks are found, the thresholds in between two peaks are found using Otsu method. After all threshold values are determined, the pixels values are substituted by weighted-mean gray value of its own range. If input image is multiband image, the image is converted into single band image. The user can specify either PCT method or rgb to gray conversion method.
REFERENCE
1. Scott E Umbaugh. DIGITAL IMAGE PROCESSING AND ANALYSIS: Applications with MATLAB and CVIPtools, 3rd Edition.
EXAMPLE
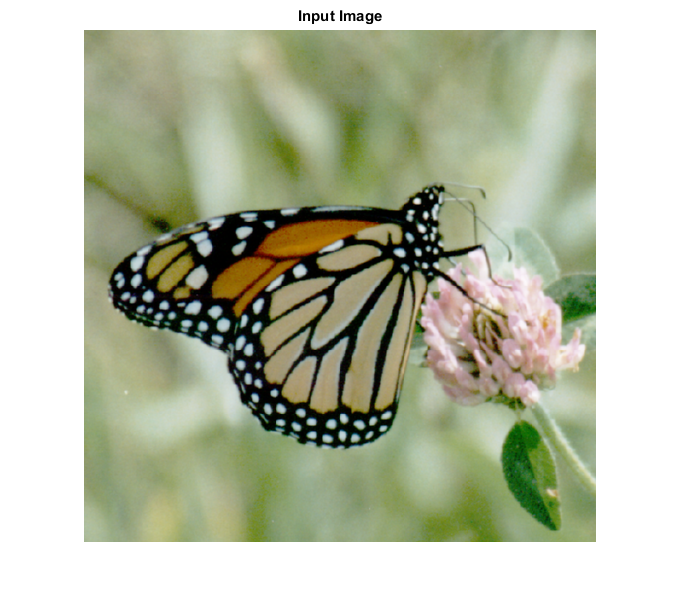
%Read images

 I = imread('butterfly.tif');

% Calling function

 O = hist_thresh_cvip(I, 0);

% Display input image

 figure;imshow(I);title('Input Image');

% Display output image

 figure; imshow(O);title('Output Image');  %function returns as double %type (range = 0-255)
CREDITS
Author: Norsang Lama, March 2017
Copyright © 2017-2018 Scott
E Umbaugh
For updates visit CVIP Toolbox Website